
In-Calc
Intended to give a quick understanding of an unfamiliar technology or system topic. Examples include predictions for:
- Blue and green hydrogen cost and impact
- Gas Grid Blend quality and carbon intensity
- Carbon capture and forestry project cost and impact
- Direct air capture cost and impact
Grid Connections
These open source resources have been gathered and shared to give users access to a varied collection of grid connection tools. This includes maps, visuals as well as data processing/planning tools to make the process of connecting small domestic and larger commercial projects to the grid easier and more efficient. These tools are also essential in identifying areas of constraints or potential locations for planned projects.

Energy & Climate Data Visualisations
These open-source resources are gathered and shared to give an appreciation of some different creative ways that complex energy and climate has been visualised to aid understanding. Complexity of energy and climate data, considering he dynamic nature and geographical distribution of emissions and renewable resources presents a key challenge in posing solutions to decarbonisation, and designing systems or modelling realistic economics for future projects.
Solar
These open source resources have been gathered and shared to give users an easy way to access solar PV tools curated to give more detailed information about solar PV for homes and commercial use. This ranges from calculators to predict costs and savings of using solar PV panels on homes to maps which can give power output and irradiation on a global scale.
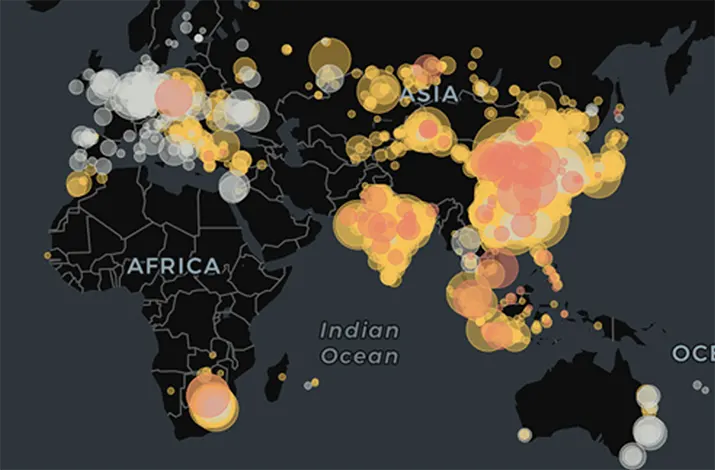
Mapping
These open-source resources give an idea of the geographical distribution and heterogeneity of power generation facilities and distribution infrastructure (both onshore and offshore); CO2 and heat emissions, and indicative regional solar, wind and tidal resources. This broad distribution of emissions and renewable resources presents a key challenge in posing solutions to decarbonisation, and designing systems or modelling realistic economics for future projects.
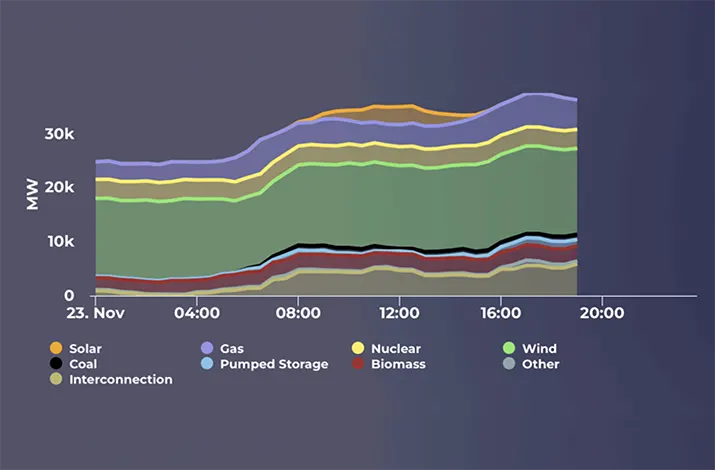
Live Data
These open-source resources are gathered and shared to give an appreciation of some different creative ways that complex energy & climate has been visualised to aid understanding. Complexity of energy and climate data, considering the dynamic nature and geographical distribution of emissions and renewable resources presents a key challenge in posing solutions to decarbonisation, and designing systems or modelling realistic economics for future projects.
Analyse. Visualise. Decide.
Contact us for a demo of our applications or for more details how we can help with your clean energy or decarbonisation projects.